Ecommerce P&L Benchmarks | What Happened in 2025 (and What it Means for 2026)
Written by: Geoffrey Gualano
March 3, 2026
A2X is partnering with Ecom CFO on the Ecommerce P&L Benchmark Report series to bring ongoing, data-driven benchmarks to ecommerce finance teams.
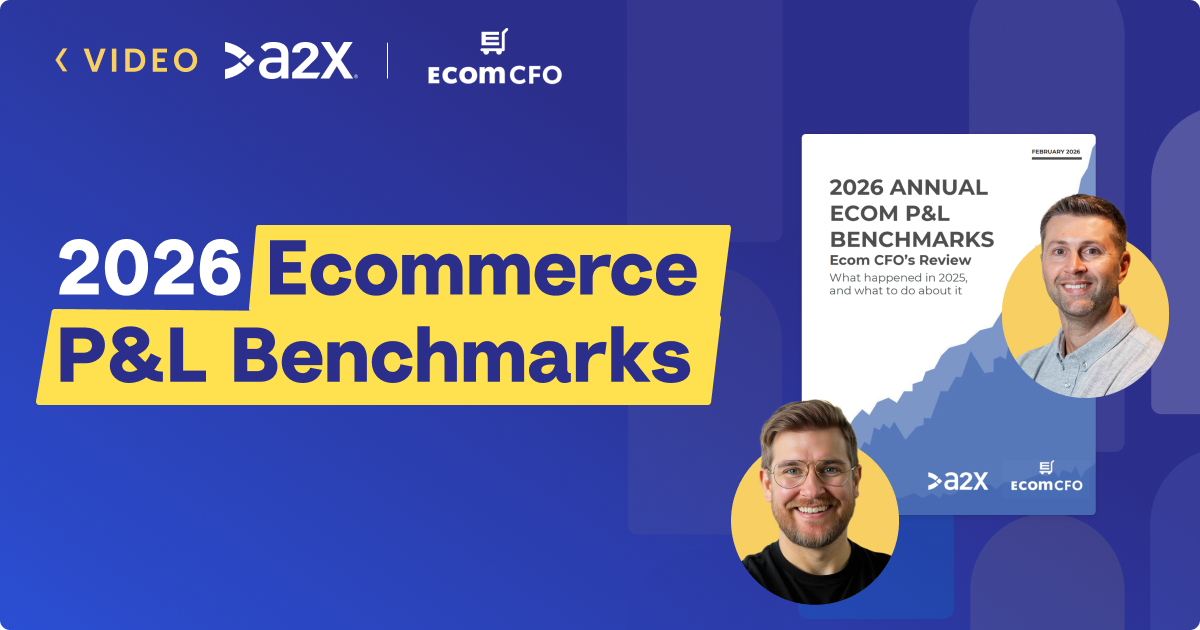
The 2026 Annual Ecommerce P&L Benchmark Report has just been released. Published in February 2026, this is the most comprehensive edition yet – drawing on full-year 2025 data from eighteen private DTC brands ranging from 7- to 9-figures. It covers the full P&L: revenue, gross margin, contribution margin, ROAS, G&A, fixed marketing spend, and EBITDA.
Watch our conversation with Sam Hill for the key takeaways, then download the full 2026 Annual Ecom P&L Benchmark Report to benchmark your own business and build a more resilient plan for 2026.
Subscribe to the Ecom CFO newsletter to get the next edition of the report delivered directly to your inbox.
Watch: 2026 Annual Ecommerce P&L Benchmarks
Geoff: So, if you've looked at your 2025 numbers recently, you've likely seen the trend. Your ad costs are up. Margins are thinner than ever. Most ecommerce sellers feel this happening, but they might not know why. The reality is that 2025 marked the end of easy mode for ecommerce. And if you're heading into 2026 using a 2023 or 2024 playbook, your growth is likely going to flatten out or worse, start to shrink. So, to help ecommerce sellers figure out how to navigate all of this, I'm joined by Sam Hill from Ecom CFO. They've just released their 2026 annual ecommerce P&L benchmark report, which breaks down real ecommerce financial data from the last year. Sam and I are going to show you exactly how ecommerce brands performed in 2025 and how you can use these benchmarks to build a more resilient growth plan for 2026.
Sam, welcome back. My moon and my stars. Uh, if you don't understand the reference, please uh look back at one of our pre previous P&L benchmark reports. I uh I always enjoy having these conversations with you.
Sam: Awesome, man. Every single time we have new and fun, exciting stuff to talk about.
Why Brands Need P&L Benchmarks (Stop Guessing)
Geoff: If you want access to the P&L benchmark report to follow along, there's going to be a link in the description below. Uh so you can get it there. So Sam, you and the Ecom CFO team provide outsource CFO services to some of the top DTC brands in the US. We're talking seven, eight, nine figure sellers, household brand names, and this is the fifth time you've put together this P&L benchmark report. Why is it so important for businesses to review this type of data as they plan into the future?
Sam: I have about 15 conversations with prospective clients every single month and I aggregated all of my calls into a Claude project. And the number one pain point by far is the quality of their financials and guessing. M I just keep hearing the word guessing over and over and over again. So much so that I change my LinkedIn banner uh to say we are the business for DTC founders who are done guessing. And the benchmark report is the resource for you to stop guessing. Period. Stop guessing about what am I doing good? Am I doing bad? where do I need to focus? What KPIs do I need to strive for? Um because so many people are completely in the dark as to what is good, what is bad, what's in the 50th percentile, what's in the 95th percentile. And so many other reports out there don't give you the full picture. They give you little snippets of maybe they talk about ad spend, maybe they talk talk about customer lifetime value or CLV to CAC. None of them give you the full P&L benchmarks.
Geoff: My two favorite things about the report honestly are one the level of depth that you guys go into. Like a lot of the reports that are out there tend to be kind of very surface level. Um, and man, you guys really really drill into the numbers and I know that you do that painstakingly as a labor of love. And the other thing is like you guys have been publishing this with a tremendous amount of consistency and discipline. And the value of that is that you can see the trends over time. So Sam, uh, a
Welcome to the Era of the "Anxious Seller"
Geoff (cont.): throughline across pretty much every P&L benchmark report that we've gone through has been the fact that we've been coming out of the end of, you know, quote unquote easy mode, the laidback seller, and it really feels like we're transitioning into the era of the anxious seller, or at least that's kind of the takeaway, the theme that I'm seeing from the reports. What What do you make of it?
Sam: I'm just commenting on what I see from our clients and other brands that I talk to in the space. People are working twice as hard for the same level of output and people are increasingly paranoid. They're auditing every single email flow. They're searching for broken links. They're testing and re retesting ad creative. Uh they're negotiating more and more with their vendors, their suppliers, their agencies. They're just leaving no stone unturned and just increasing their level of paranoia with every part of their business. Let's dive
2025 Revenue Growth by Cohort
Geoff: into what you saw happen in 2025. But we always start with the magic number which is revenue growth. What did you see across your brands in 2025?
Sam: Yeah. And and to provide a little bit more context um in the report we separate revenue cohorts. So the way that we bucket the information in our reports is less than 10 million in annual revenue. Bucket two is or we may call it the middle cohort in our conversation is 10 to 50 million in annual revenue and then the last cohort is the over 50 million in revenue. Uh so three different buckets because uh all those companies performed very differently and if you can't just bucket all of ecommerce together. So generally speaking with revenue was per usual a mixed bag. Um the under 10 million cohort uh performed actually quite well better than I certainly expected. Um the middle cohort that 10 to 50 million uh there is a lot of red in this cohort not just in revenue but in pretty much all of the metrics which was pretty surprising. Uh, and I'd love to talk more about that. And then in the over 50 million cohort, um, that cohort also grew pretty tremendously. I mean, 40% on average, and the med the median was 33%. So, a pretty significant growth in that larger cohort, too.
Geoff: That's interesting. I' I'd love to kind of drill into this a little bit because, you know, at A2X we work with thousands of brands and our data slightly deviates from what you're seeing. So, for example, for smaller sellers, we're seeing smaller sellers struggle struggle, but you're saying that kind of in your 1 to10 million cohort, they actually did relatively well from a revenue perspective. Do you think that's a symptom of the fact that, you know, they're potentially a more sophisticated seller? Like I would say the fact that they're working with y'all like Ecom CFO I think is is a good signal.
Sam: No. Um that's very nice of you to say. I think that there there is some survivorship bias in our data. We're not the cheapest firm to work with and I'm very unashamed of that. Um so there there is some bias of hey you know we're working with a a more expensive firm so therefore they're going to be more profitable have higher revenue growth um than you know someone who's just running their business as a smaller lifestyle brand. The the second component of that is if you look at the average revenue it's uh our average in this cohort is 4 6 million. So we are working with a little bit larger seller within that cohort. And then I think the last component that we we talked about before we started recording is that you know there is a pretty low floor this year because 2024 wasn't great.
Geoff: Yeah.
Sam: So any any improvement looked like pretty significant improvement.
Geoff: Yep. That makes a ton of sense. So let's let's get in a a level below that uh
Gross Margin Trends & Surviving Tariffs
Geoff (cont.): into gross margin. What what did you see happen in gross margin? Was it much of the same across the three cohorts?
Sam: Gross margin I think is probably the most interesting story uh certainly one of them because I expected and I think everybody expected gross margins to decline uh much more dramatically than they actually did. I mean, if you look at the under 10 million cohort, I mean, it's effectively flat. Uh, the 10 to 50 million cohort, uh, only declined by about 2% both the average and the median. So, there's no like big outliers pulling that data one way or another. And then the over 50 million cohort actually improved gross margins by about the same, about 2%. Um, but you know, we've been tracking this phenomenon across all of our benchmark reports, um, that you really have to be 70 plus% to start to break into this um, 8 figure level. At below 70%, it's just more and more difficult to scale. um you know maybe some some harder core retail brands could buck that trend but generally speaking you know 70% is a a very strong feature or I I would even say correlation between you being eight figures or not.
Geoff: I can we pause on this for a second because you know what strikes me here is we thought that tariffs were going to have a massive impact in this area right are you suggesting that they didn't necessarily have an impact or are you suggesting that the brands did a good job of playing defense against those impacts
Sam: I would say more the latter again um if if a brand was significantly impacted by tariffs to the extent where it was, you know, existential and it was going to kill their business. They didn't hire us because they didn't have the budget. So, again, there there's a little bit of survivorship bias. Um, but I think generally speaking, brands did a pretty good job at raising prices, cutting SKUs, negotiating with their suppliers, or I think the dirty secret is um avoiding evading the tariffs altogether. Nobody wants to say it, but I will. Um I I I mean that's just the honest truth and it it shows in the data period.
Geoff: Got it. Okay, that makes a ton of sense. All right, let's let's now transition into contribution margin. And before we do, I think a lot of the contribution
Contribution Margin & The Ad Spend Debate
Geoff (cont.): margin story. We can kind of really dive into ROAS and marketing. So I like I just there are obviously debates about this in the industry ad cost in contribution margin or not in contribution margin. To me, there's no question that you should include ad spend and contribution margin. I don't think it's debate. Um, but yeah, that's that's my opinion.
Sam: I mean, yeah, then you should jump into those LinkedIn debates, man. Um, strong opinion.
Geoff: So, so, so talk to me about Okay, so like contribution margin, what are you seeing there?
Sam: Yeah. So contribution margin overall again um kind of similar story to revenue improved for the under 10 million cohort and improved for the over 50 million cohort. Um did not improve and in fact declined for the 10 to 50 million cohort although not substantially. I mean we're talking 2%. So, you know, if I'm looking at the data, the 2024 average was 28%, 2025 average is 27%. I would call that largely flat. But if you look at the over 50 million cohort, um, where every percentage really matters. Uh, they went from 18% to 19%. That is a that that's significant. That's that's serious dollars.
Geoff: And you've also been seeing some pretty
ROAS Erosion & Rising Ad Costs
Geoff (cont.): interesting trends as it relates to ROAS and marketing, right? Um I'd love for you to drill into those.
Sam: Yeah. So when you see contribution margin increasing or at least being flat, some immediate expectations come to my mind. I would have expected return on ad spend to actually improve and it did, but only for the small cohort. So return on ad spend went on average from 5.6 6 to 6.5 for the under 10 million cohort. The return on ad spend for the 10 to 50 million cohort and the over 50 million cohort actually decline by a pretty meaningful amount. Um in both the average and the median. Again, all that means is the closer the average and the median are together, the more it means that it's there's not an outlier. But if the two diverge significantly, that that tells us that there are probably some outliers. But both of those declined by almost 10%. And you know, we've said this before, but if you go look at Meta's earnings call and the earnings report that they put out, you will notice that their ad cost or their ad efficiency or the money that they make from ads increase by about 8 to 10% a year. So it's no surprise that you're going to get return on ad spend erosion over time and we're seeing that very very clearly in the data. I I think that's the return on ad spend story. So like you know then again if contribution margin stayed flat or increased slightly and return on ad spend went down like what what else is left? And you know, some of the the pickpack ship costs come to mind. And so it's very possible, and I saw evidence of this, of, you know, brands getting smarter around their total offer, meaning maybe they've increased their shipping threshold from 100 to 150, from 150 to 200. uh and that would account uh for uh some of that would explain some of the the contribution margin story or again just just raising prices. You know in some cases they did pull back total ad spend dollars themselves so deployed less dollars um and return on ad spend declined. So therefore, you know, they would have seen uh more revenue like from uh existing customers and so that would have driven contribution margin up up slightly. Uh so you know, so there's a bunch of of different reasons, but those are some examples.
Geoff: Sam, there's one really interesting thread um that is popping out to me here
Why Smaller Brands Are Winning (Founder Focus & AI)
Geoff (cont.): for the 1 to10 million cohort. The revenue is going up and the ROAS is improving. And we're also talking about the fact that all of these ad platforms are increasing cost. So the cost of ad inventory is also going up. Like I know that there's a little bit of survivor bias here and I'm sure that there are a lot of people listening or watching that might want to talk to these $5 million sellers, but like sounds like they're doing relatively well in a very competitive market uh without potentially the operational maturity and and sophistication that you would expect. Like what's what's going on here?
Sam: Yeah, it it is really interesting and I think there's a few factors going on here. Um, again, some survivorship bias for sure. Um, another one is just the ability to be nimble and try stuff faster than the larger businesses. And there there it's a little bit more nuanced than that even because I would say that for most of our clients under 10 million, it is the founder or co-founder who's very very close to marketing, ad spend, checking campaigns more often, auditing email flows, and they're much more connected to the day-to-day ins and outs. of marketing. And so when something doesn't work, they're actually the ones going in and diagnosing, fixing, testing. And once you get to that eight and especially nine figure range, yes, those same founders are uh looking at marketing generally, but they're less in the weeds because they've hired a CMO or they're relying on uh more agencies. And no one is going to care more about your business than the founder, CEO, period. Of course, and and fixing those issues faster and more comprehensive. So, I I think that that's uh I think that's a huge part of it. Um, and also because the smaller companies also have less to lose, meaning, okay, maybe they didn't order as much inventory. So therefore, they can pivot, kill SKUs earlier, edit their catalog again, turn off and on different campaigns or test test different channels. Again, they can just be so much more uh nimble and responsive than the larger businesses can.
Geoff: And we're also not even mentioning, you know, the two-letter acronym that everyone is thinking about right now, which is AI, right? Like they, if you are smaller, if you are nimble, um, if you don't have tons of approval layers, you're probably benefiting from the use of these tools to develop more ad creative, more, you know what I mean, just variants, so on and so forth. Uh so there's there's potential that being small um actually sets you up for success in a world where AI is becoming more viable as uh uh you know as a potential solution to the ad problem.
Sam: Yep. That's exactly right.
Geoff: Okay. So we've talked quite a bit about
The Fixed Marketing Cost Trap for Mid-Size Brands
Geoff (cont.): ROAS but you've also noticed an interesting trend in the fixed marketing cost. Right. So, and and I find that this is particularly interesting in the the middle cohort, the 10 to 50 million and the 50 million plus. Their fixed marketing cost went up while the ROAS is going down. Like what? Like what's going on?
Sam: Yeah, exactly. And this is the first time we've reported on fixed marketing cost as a percentage of revenue. We usually only report on total GNA which we believe that fixed marketing should be a function of fixed fixed cost or or GNA but we've provided both numbers for I think more more context the total GNA and fixed marking as a percentage of revenue and yeah you're exactly right so I think the thesis was hey if we're going to invest more in fixed marketing Meaning, you know, more agency spend, more marketing salaries, more content generation, uh, better tools, then yes, our fixed marketing spend as a percentage of revenue will increase, but our return on ad spend will increase and our contribution margin will increase. And particularly for that middle cohort, 10 to 10 10 to 50 million, that story just did not play out. And I don't have as complete of a reason as I wish I did. Um, but I think, you know, we were talking before we started recording and I I think that a lot of those companies are still in um they're not in harvest mode yet. They're plant they're planting the seeds. Um they're setting up the systems. They're making investments in people etc. And they have just really not harvested the gains from that investment yet.
Geoff: Yeah. Well, with that statement, right, like when we look back at the results from 2026, we'll be able to validate if it if it came to pass.
Sam: Yeah. and and and if you actually look at the because we we provide both metrics return on the ad spend and we also provide the ad spend dollars. So because the the the traditional view is well if I deploy less ad dollars my ad spend my return on ad spend is going to go up. like we we all intuitively kind of get that. But again, the ad spend dollars deployed in 2025 versus 2024 um declined, but the return also declined, which is crazy. And my fixed marketing costs as a percentage of revenue went up. Uh so yeah, I mean the again the 10 to 50 million cohort is really just feeling it on on all ends right now.
Geoff: It means like like it's not crazy to me for a simple reason and hear me out on this. Like if you're in the like you talked about the competitive advantage that the 1 to 10 million have in that the founders are still doing a lot right they're still super close to a lot of the work right and then once you get to the 10 to 50 million it's not to say that the founders aren't involved but you have significantly more operational complexity. It just it is what it is like at that size, inventory, staff, so on and so forth. And then when you're in the 50 million plus, sure you have operational complexity, but you now have some weight to throw around. Whether that's weight to kind of negotiate payment terms with your inventory suppliers or to negotiate prices down. Um whereas like in that 10 to 50 million range, you might not have that kind of like large seller benefit and you don't have the nimbleness of the small seller benefit. So you're like in this weird middle makes that makes it tough especially when the marketing environment is getting significantly more challenging and significantly more expensive. Um now I'm just going to stop talking. Tell me if my that point of view is crazy or not.
Sam: No I think that's exactly right. And look you and I aren't the only people
The Challenge of the "Messy Middle" ($10M-$50M)
Sam (cont.): saying this. I mean, if you listen to the operators podcast, um Sean Frank talks about this a lot that like getting to that escape velocity, which I think he defines in this 30 to $50 million range, like it is despite everyone's like initial assumption, it's it's really difficult to get to that. And but once you break through that, it does start to get quote unquote easier. um because you've reached a a large enough scale to be able to overcome some of these problems. Um and you have you have more mass like you said to be able to negotiate um cutting different costs has a a bigger impact etc.
Geoff: Yeah, 100%. Like like harvesting becomes a reality at that point, right? Vis-a-vis in that middle range, 10 to 50 million. To your point, it sounds like a lot of people have been setting themselves up for a big 2026. And like I'm hopeful and I'm optimistic that they're going to have it. Uh, and I'm wishing everyone a lot of success. So, if you're listening and you're in that range, you've got this. Um, hey, so take us home. Let's let's
2025 EBITDA Results
Geoff (cont.): let's bring us uh to the last metric which is uh EBITDA. What what did you see here? What surprised you and what held true uh in 2025 comparatively to previous years?
Sam: You know, Geoff, you and I spent a lot of time talking about contribution margin because it's a great general health indicator of the business and and how that's trending. And also it includes ad spend which is one of if not the biggest cost. But really where the rubber meets the road and why we all start and grow businesses is for EBITDA. And in EBITDA we we mentioned this before but 2024 provided a pretty low floor. So uh I was going to be very surprised if companies didn't outperform 2024. And I'll say this, I mean, the average still doesn't look spectacular for brands, period. I mean, the average for under 10 in 2025 was 7.8. 10 to 50 million cohort, the average was 7.25. The average for the over 50 million cohort, the average was 9%. So, we're still for the average business sub 10% in EBITDA. And you can take that number and compare it across you know different industries to to SAS to construction to professional services whatever uh that is a metric that that we can look across industry for but generally speaking companies did perform better I mean the the less than 10 million cohort again they had a very low floor 5% in 2024 and they improved almost 60% % going from five to to almost 8%. Uh again, um more blood in the water for the the 10 to 50 million cohort. I hate to be so doom and gloom in in this bucket, but um they got less profitable. And then lastly, the over 50 guys, uh they improved from 8% to 9% or uh about 12% in total.
Geoff: It totally makes sense. I mean, like to be honest with you, based on this conversation, at least there were some green shoots. We've had previous conversations where where every cohort was struggling, but you know, I'm I'm hopeful for the little guys, the 1 to 10. I think they did a good job this year. Um, and I'm optimistic for that for that kind of middle 10 to 10 to 50 million as mentioned. Um, here's my last
2026 Forecast: Why You Should Rethink 25% Growth Targets
Geoff (cont.): question, man. And and I actually really appreciated this as part of the report because it was a little bit of a wakeup call especially as you know even us in SAS and and ecommerce like we look at the year ahead and growth and and and putting together some growth objectives and like 20 to 25% revenue growth feels realistic standard but you you kind of threw a little bit of cold water on that in the report. So, if if you're an ecommerce business within any of these cohorts planning to do 20 to 25% in in uh revenue growth, talk to me about why you might want to re-evaluate that.
Sam: Yeah, the I got frustrated with our own reports because our reports are delayed. Uh, I mean, it's it is February the 20th when we're recording this and we're talking about 2025 data and and nobody nobody wants, you know, 60-day uh old data. Um, so, but it's critically important and we can't have the data until the actual actual time passes. So what I wanted to do is not only provide the historical information but also provide what our outlook is for 2026. So there is a separate report um that looks at all the future stuff and kind of what my my prediction is and the long story short is if you look at the health of the average consumer from a macroeconomic perspective um it's very mixed. If you're in the, you know, upper percentile of, let's just call it, you know, society, you're doing okay. If you're in the lower percentiles of society, you're doing less okay. And so therefore, buyers have less ability and a worse market perception, again, depending on who you are and and and uh where you fall. And so my TL;DR summary perspective is unless you have a step change growth lever like you're launching in a completely new geography a completely new channel a a completely new hero product you should be very careful if you are forecasting growth greater than 10% period and I think even with you know a lot of the clients that I talk to we're forecasting revenue you know to be flat or in some cases down and you know and then how does that impact your your decision- making sorry that's way more than you asked for but I think it's really important right because you know forecasting that revenue growth impacts hiring decisions impacts investment right like having a realistic outlook for the year ahead informs so much of your strategy I know that we're 60 days late so we we'll it's not an apology like you you just you want want to make sure that the numbers are right, right, and good to go. Uh, but maybe I guess the call out, Sam, is to take a hard look at at your 2026
Operational Discipline & Maximizing Longevity
Geoff: objectives and there's still time to potentially re-evaluate. Like, what's what are your thoughts there?
Sam: No, exactly. I mean any one year in a vacuum can be great, it can be not so great, but the the most important thing as an entrepreneur in general is staying in the game. And the riskreward that you have from being wrong in missing your growth projection has never been higher. And so, you know, what we're advising our clients is, hey, we're we're maximizing for longevity. And what gives you the best percentage chance of being in business 5, 10, 20 years from now? That's expecting the worst and hoping for the best. And and and how do I prepare accordingly? How does that impact my decision- making? it it looks like, hey, maybe I I don't order quite as much inventory. Maybe I push off that new hire for another quarter, another half of the year. Maybe I, you know, reevaluate some trips that I'm going to take. Maybe I, you know, reduce my application budget or my, you know, my fixed marketing budget. Uh, so I I don't think it's it's making like dramatic choices. I think it's about making intelligent, shrewd, like sober choices, setting yourself up for the long run.
Geoff: You've effectively touched this on pretty much every video that we've done on this topic, but it's really about discipline, operational discipline, right? And using the numbers to inform where that discipline needs to take effect. So, um, I hear you and I and I hope that everyone listening hears you as well. Um, so Sam, man, I always love chatting with you about this topic. Very much appreciate you and the team putting together the report as mentioned. You can find it in the link in the description below. Um, yeah. Uh, anything that you want to leave us with or or just a a nice sign off? Man,
Final Thoughts & Where to Get the Data
Sam: there's just there is so much to be excited about and I I I hate sometimes that I seem to be the downer sometimes in in our space because I see the actual data and you I think frankly a lot of the market marketers see or interpret the data as more positive but we as finance people just don't have that luxury and I think it's a really important voice in our space space that has like had the volume turned down for the last few years and I think people are turning the volume more up on these types of opinions and perspectives and at the end of the day I'm just one I'm one voice and one perspective and so that's why I think it's super critical just to give people access to the data and less of my commentary and more of hey here is the data interpret it as you will. Put it into Claude, put it into ChatGPT and and compare and ask it as it relates to your business. Period.
Geoff: I mean, I think you're selling yourself short. I think uh you know, a lot of people really appreciate the key takeaways and the insights from you specifically as it relates to the data. Like we see that all the time when we send it out in the newsletter report. People comment on it specifically. So, uh I'm just going to leave it at that. Thank you for putting it together. And if you do want to get in touch with Sam and the Ecom CFO team, we'll also put a link in the description below on how to do that. Thanks for watching everyone and we'll see you next time. Thanks Geoff.
TL;DR – 2025 annual ecommerce financial performance
- Revenue – A tale of two markets. Brands under $10M grew 24.24% on average and brands over $50M grew 41.21% – but the $10M-$50M mid-market contracted 4.60%. If you’re in the middle, it was a tough year.
- Gross margin – Held remarkably steady across all cohorts despite tariff headwinds – mostly flat to +2.38 points. Brands largely absorbed the pressure through price increases, SKU cuts, and supplier negotiations.
- ROAS – Declined 9.07% for mid-market and 8.79% for large brands, consistent with Meta’s own reported industry-wide decline in ad efficiency. Smaller brands bucked the trend with a 16.51% ROAS improvement.
- Fixed marketing costs – Rose sharply for mid-market brands (up 31.83% on average) even as ROAS declined – a double squeeze that helps explain why mid-market profitability fell.
- EBITDA – Small brands had a breakout year (up 56.95% on average). Mid-market brands got less profitable. Larger brands improved on average by 12.36%, but the median tells a different story with a 0.92% decrease.
- 2026 outlook – Unless you have a step-change growth lever, be very cautious about forecasting more than 10% revenue growth. Sam Hill’s guidance: plan for flat or modest growth, and build your decisions around that.
What we learned in 2025
The story this year is split: the smallest and largest brands grew and improved profitability, while the mid-market got squeezed on nearly every metric.
Across 18 private DTC brands tracked by Ecom CFO throughout 2025, a clear pattern emerged. Size matters – but not in the way most founders expect. The middle of the market, brands doing $10M–$50M in annual revenue, faced a compounding set of challenges that hit revenue, margins, and profitability simultaneously. Meanwhile, brands under $10M and those over $50M found ways to grow and, in many cases, improve their financial health.
Here’s what the data actually showed.
1. Revenue growth – bifurcated by size
The mid-market decline is not an outlier story. The median and the average both point down, meaning the typical brand in this cohort genuinely shrank. Eleven of the eighteen companies in the report grew revenue – but within the $10M-$50M band, the spread between best and worst performers was 53 percentage points.
- Under $10M: Saw an average revenue change of +24.24% (median +14.66%).
- $10M-$50M: Contracted with an average change of -4.60% (median -4.16%).
- Over $50M: Led the pack with an average change of +41.21% (median +33.08%).
For the under-$10M cohort, growth was broad-based. Even the 5th percentile only dipped to -8.12% – very few small brands went backward. And the over-$50M cohort had a standout year, with median growth of 33.08% confirming that scale, channel diversification, and ad spend efficiency are compounding advantages at the top end of the market.
Why this matters for your business: If you’re in the $10M-$50M range and you grew in 2025, you outperformed most of your peers. If you’re under $10M or over $50M, the wind was at your back – but the more important question is whether that growth was profitable.
2. Gross margin – held where it shouldn’t have
Given the tariff environment throughout 2025, most observers – including Sam Hill – expected gross margins to compress more than they did. The fact that they held largely steady is a signal that brands were active: raising prices, cutting underperforming SKUs, and negotiating harder with suppliers.
- Under $10M: Remained steady with an average gross margin of 67.09% (a minor -0.45% change).
- $10M-$50M: Saw a slight dip to an average of 69.79% (down -2.07%).
- Over $50M: Actually improved to an average of 79.31% (up +2.38%).
The data also reinforces a benchmark that Ecom CFO has tracked consistently: brands with gross margins above 70% are far more likely to reach and sustain 8-figure revenue. Below 65%, scaling becomes increasingly difficult regardless of cohort.
One important note: there is some survivorship bias in this dataset. Brands hit hard enough by tariffs to face an existential threat likely weren’t the ones investing in outside CFO support – which means the most severe gross margin compression may not be fully captured here.
Why this matters for your business: If your gross margin is below 65%, you’re trailing most peers regardless of size. And if tariffs are still weighing on your COGS structure heading into 2026, now is the time to build a scenario plan – not wait and see.
3. Contribution margin and ROAS – the middle cohort caught in a squeeze
The ROAS decline for larger cohorts lines up almost exactly with what Meta disclosed on their own earnings calls – ad efficiency is declining industry-wide, and the Ecom CFO data validates it.
- Under $10M: Bucked the trend with a 16.51% average ROAS increase and a 30.86% contribution margin.
- $10M-$50M: Faced a 9.07% average ROAS decline and a 27.23% contribution margin.
- Over $50M: Saw an 8.79% average ROAS decline but maintained a 19.05% contribution margin (up 5.37%).
The more troubling finding for the $10M-$50M cohort is that ROAS declined, average ad spend dollars fell 6.82%, and fixed marketing costs as a percentage of revenue rose 31.83%. They’re investing more in the marketing machine and getting worse results out of it.
For the under-$10M cohort, the story is different. Founder-led brands that are deeply involved in day-to-day ad decisions – testing creative faster, auditing campaigns personally, and pivoting quickly – appeared to benefit meaningfully from their proximity to the business. Combined with emerging AI tools for ad creative development, smaller and more nimble operators seem to be finding real efficiency advantages that larger organizations have yet to capture.
Why this matters for your business: Don’t look at ROAS in isolation. The brands that are winning are tracking total customer acquisition cost – variable ad spend plus the fixed infrastructure that supports it. If your mid-market brand is watching ROAS decline while fixed marketing costs climb, that’s the most important problem to solve before 2026.
4. EBITDA – small brands won, mid-market lost ground
The under-$10M cohort had a genuine breakout year on EBITDA. Both the average and the median improved significantly – meaning this wasn’t driven by outliers. The typical small brand meaningfully improved profitability in 2025.
- Under $10M: Average EBITDA% rose to 7.86% (a 56.95% increase).
- $10M-$50M: Average EBITDA% fell to 7.25% (a 27.29% decrease).
- Over $50M: Average EBITDA% landed at 9.04% (up 12.36%), though the median decreased by 0.92%.
For the $10M-$50M cohort, EBITDA declined from roughly 10% to 7% – a real and material step backward, reflected in both the average and the median. And for the over-$50M cohort, the average improvement looks encouraging until you check the median: -1%. A few outlier performers pulled the average up. The typical large brand got slightly less profitable, not more.
The broader benchmark to hold onto: If your EBITDA margin is above 8%, you’re at or above the median in every cohort. Below 0%, you’re in the bottom 5% regardless of size.
Why this matters for your business: EBITDA is where the rubber meets the road. Contribution margin tells you how the business is operating day to day; EBITDA tells you whether it’s actually building value. Right now, the path to EBITDA improvement runs through overhead discipline – not revenue growth alone.
5. G&A and fixed marketing – scale is the only real defense
Small brands tightened up: G&A as a percentage of revenue fell from 25.36% to 23.00%, and fixed marketing spend fell too. That combination – more efficient on paid spend and leaner on overhead – is a big reason EBITDA improved for the under-$10M cohort.
- G&A efficiency – The Under-$10M cohort reduced G&A by 9.31%, while the $10M-$50M cohort saw costs rise by 9.18%.
- Fixed marketing spend – Small brands cut spend by 20.96%, while mid-market brands saw a sharp 31.83% increase.
The mid-market went the other direction on both counts. When revenue is already declining for this cohort, adding overhead becomes a compounding problem. The investment thesis – more agencies, more marketing headcount, better tools – simply hasn’t paid off yet in the numbers. Sam Hill’s view is that many of these brands are still in a planting-the-seeds phase, and that 2026 may be the year the harvest begins. But that requires patience, discipline, and a realistic plan.
Over-$50M brands hold fixed marketing mostly flat (at 1.66%) as a percentage of revenue because their revenue growth absorbs the added dollar cost. That’s the benefit of scale.
What 2025 tells us about planning for 2026
Unless you have a step-change growth lever, be very careful forecasting more than 10% revenue growth.
That’s Sam Hill’s direct guidance coming out of the full-year data – and it’s worth sitting with before you finalize your 2026 budget.
The macroeconomic picture heading into 2026 is mixed. Consumer spending power varies widely depending on income level. Ad costs continue to rise structurally. Tariffs, for most brands, appear to be a permanent feature of the cost landscape rather than a temporary disruption. And the operating environment rewards lean, founder-close businesses in ways it hasn’t always before.
Next steps
2025 was not an easy year for most ecommerce brands. But within the difficulty, there were real green shoots: small brands getting leaner and more profitable, large brands finding new scale, and operators across the board getting smarter about where they spend and why.
The brands that are going to win in 2026 are the ones going in with eyes open – not chasing the ghost of 2021 growth rates, but making intelligent, sober, disciplined decisions based on what the data actually says.
If you haven’t benchmarked your own P&L against these numbers yet, now is the time.
Want the full dataset?
Download the 2026 Annual Ecom P&L Benchmark Report from Ecom CFO for the full cohort breakouts, percentile data, and methodology.
Subscribe to the Ecom CFO newsletter to get the next edition of the report delivered directly to your inbox.
Frequently Asked Questions

Subscribe to the A2X Newsletter
Subscribe to the A2X Newsletter for expert ecommerce accounting advice and practical resources delivered straight to your inbox.
Subscribe now
ABOUT THE AUTHOR
Geoffrey Gualano
Geoffrey Gualano is a marketing leader with a decade of experience building B2B SaaS brands. At A2X, he leads a team of expert marketers to help ecommerce businesses, their accountants, and bookkeepers save hours while increasing the accuracy of their books with accounting automation technology.