
A2X Newsletter | Q1 2025 P&L benchmarks for your ecom clients

Ecom CFO recently released their Q1 2025 Ecom P&L Benchmarks Report – and it’s a must-read for your ecommerce clients who want to:
• See how they stack up against similar brands
• Use clear data to shape strategy for the rest of 2025
• Uncover hidden cost-saving and profit-boosting opportunities
The report is completely free – download it here.
We’ve invited Sam Hill, Founder & CEO of Ecom CFO, to share key insights (and expert commentary) from the report below ⬇️
(Or, catch Sam on our YouTube channel discussing the report.)
Questions? Respond to this email, or get in touch with Ecom CFO.

Thanks for having us back, Geoff! A2X powers around 80 % of our clients, so it’s awesome to be here.
Whenever we sit down with founders to review their books, we hear some version of the same question: What are you seeing in the market?
You’ve probably heard some version of this question, too – especially this year.
As a fractional CFO firm, dedicated to publishing industry-best insights, one way we help answer this is through our benchmark reports – how private brands are performing, with details on revenue, gross margins, contribution margins, EBITDA and more.
We just published the latest issue with data from Q1.
The full thing is 20 + pages, but today, we’ll unpack:
- The Big Picture
- The Most Important Conversation We’re Not Having
- Ways To Improve Unit Economics
Before we do, here’s a quick reminder to anyone new on how to make sense of the data: We analyzed Q1 2025 and compared it to Q1 2024, breaking companies out into three different revenue cohorts, and showing average performance for both periods, as well as absolute- and percent-change from one year to the next.
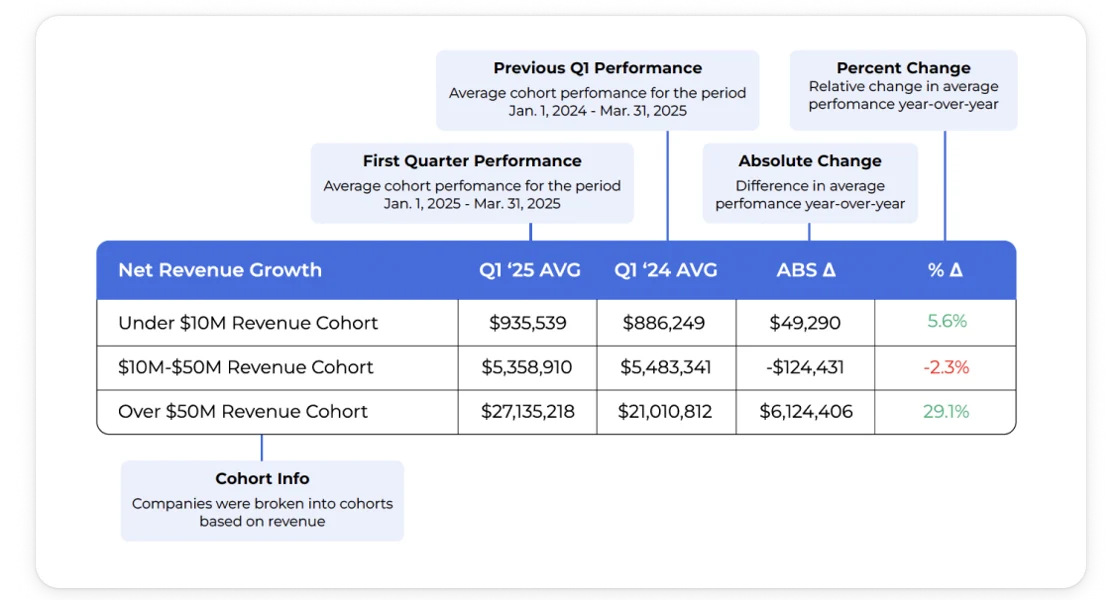
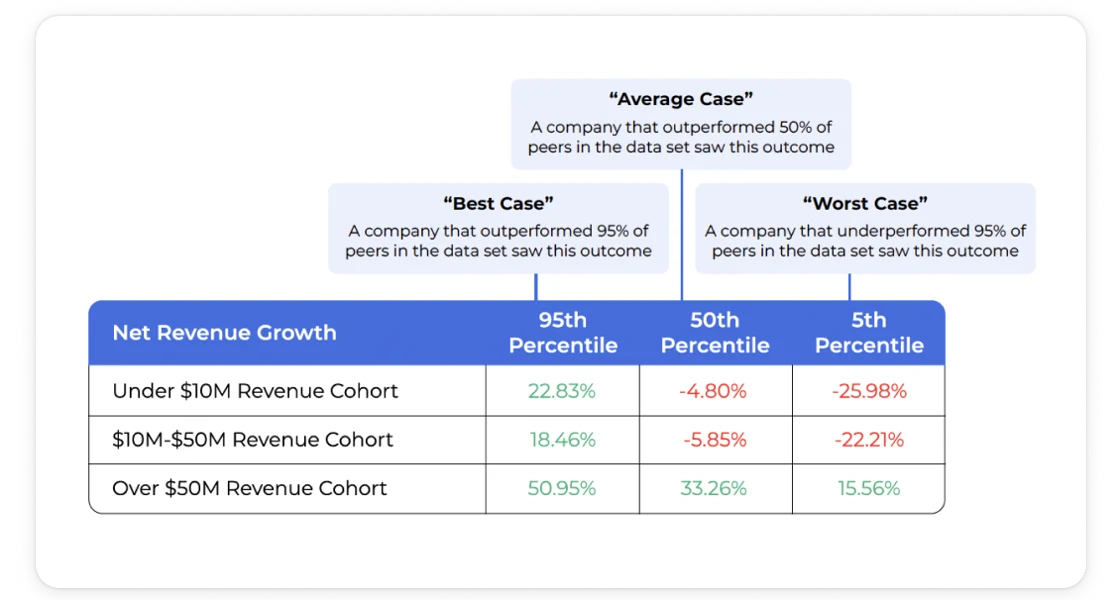
Most sections also have a percentile breakout. These will help you understand where your brand is in terms of the full spectrum of performance for your revenue cohort.
1. The Big Picture: The Best Brands Are Still Growing, Despite The Environment
Things are still tough out there, but the data shows that there’s still plenty of room for great brands to grow.
The 95th percentile of every cohort saw ~20 – 50 % revenue lift. Wholesale continues to expand, growing ~9 – 40 % across our sample, and representing a bigger chunk of the overall revenue pie than it did 2024.
Further down the P&L…
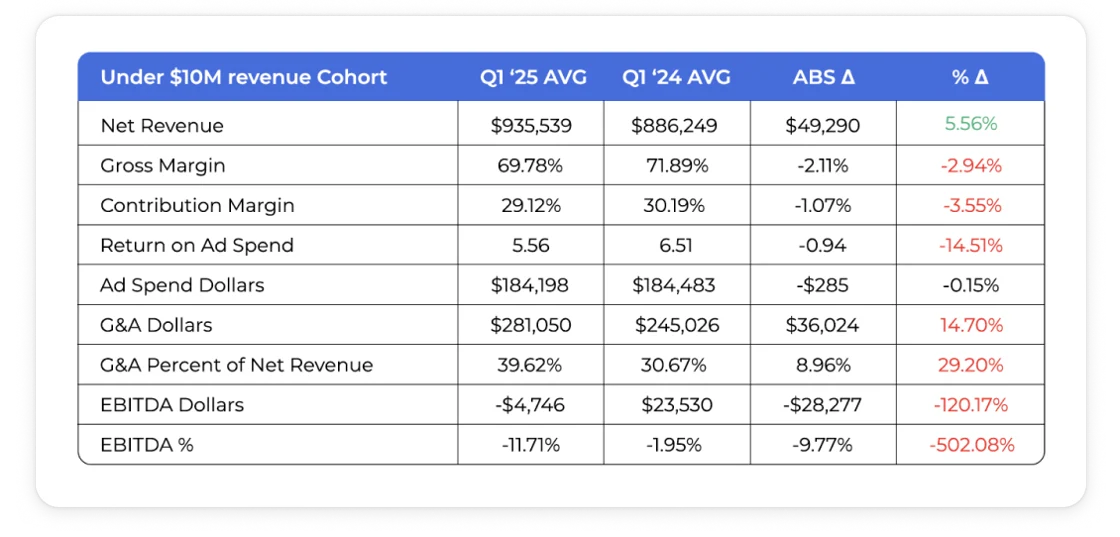
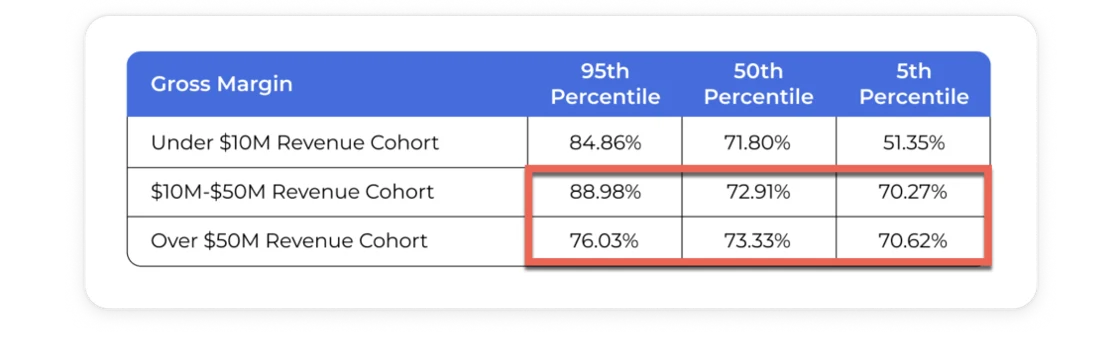
- Gross margin was about even, though some are enjoying the payoff from years of discipline. Very few brands under $10 M have gross margins lower than 70 %.
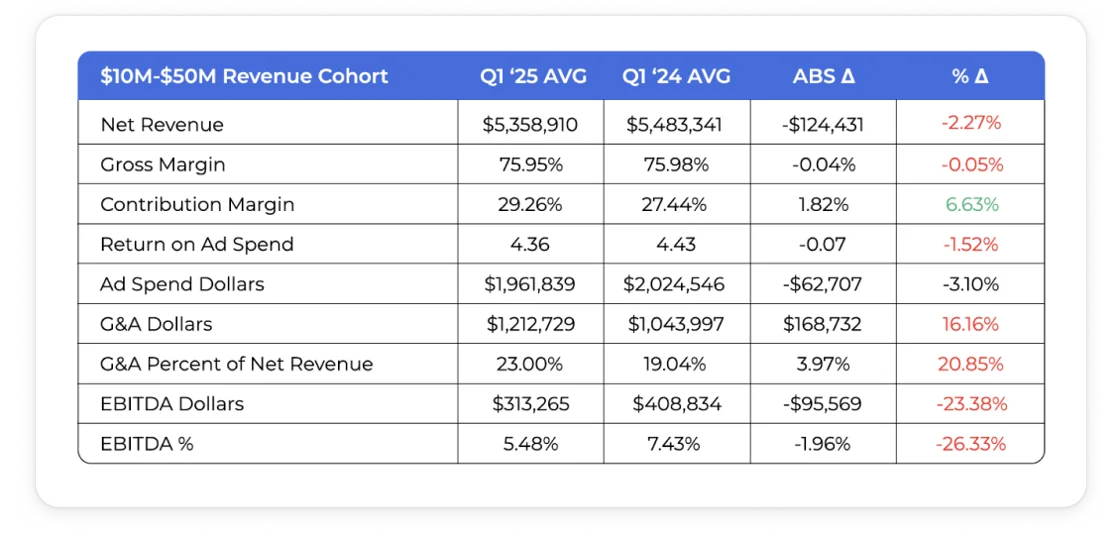
- Contribution Margin was up a surprising 17 % overall average, despite flat gross margins and declining ROAS. Most (but not all) of that among $50 M + brands.
- EBITDA was a mixed bag, falling dramatically for companies under $50 M, where G&A is up ~15 %. G&A is up for the $50 M + cohort too. Revenue’s just growing faster.
The message here is simple: Founders need to be maniacal about protecting margin right now. Those who do are enjoying lots of opportunities to eat up market share while competitors struggle.

2. The Most Important Conversation We’re Not Having
I want to double click on this concept of protecting margin above, because I think it’s so important right now.
The other week I was in New York City, speaking alongside Neil Patel and others at the MDS Annual Chapter Event.
On-stage, it was a normal lineup of marketing and advertising talks.
But off-stage, the real conversations were around unit economics, supply chain optimization, deal flow, and general paranoia/anxiety.
The US – China trade deal seems to be stabilizing tariffs somewhere around 55 %.
But data from our Q1 Benchmark Report (pre-tariffs) shows that the highest performing brands of all sizes, and virtually all brands doing 8- to 9-figures, have gross margins over 70 %.
So the big question facing brands right now is how can they maintain healthy margins in the wake of a 55 % COGS hike?
In most cases, unit economics needs to be the top priority.
Fixed Costs Are A Distraction
The natural reaction of most founders faced with rising costs is to either cut fixed costs or try to make it up with more efficient marketing.
Fixed costs feel important and inherently more visible when looking at the P&L every month.
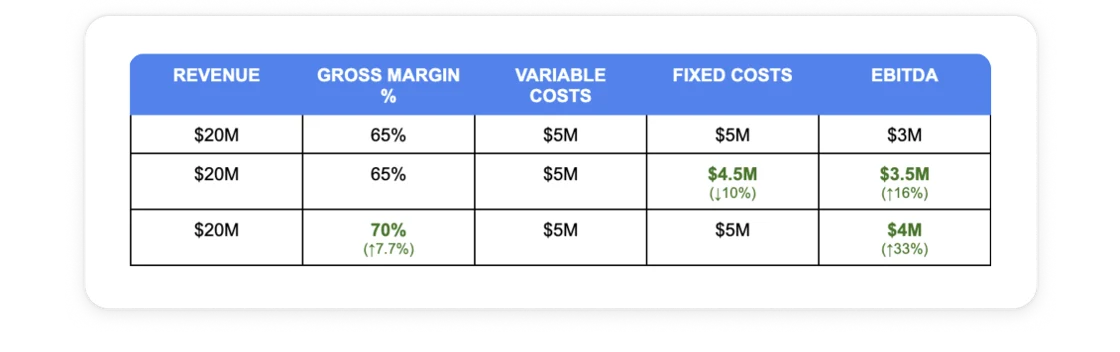
But look at the table below.
At scale, smaller improvements in unit economics are several times more impactful than cuts in fixed costs.
Marketing Efficiency Is Also A Distraction
You could make the argument that marketing efficiency gains also flow directly to the bottom line, allowing you to generate more revenue with the same ad spend, or hold revenue stable while spending less.
But brands should consider this…
If you’re making a product in China right now, paying $3 for it and selling it for $10, your costs just went up by 55 %.
You’re now paying $4.65 per unit, and your gross margin dropped from the goldylocks zone of 70 % to an abysmal ~54 % (on-par with the worst performing 7-figure brands in our recent study, and virtually unheard of among 8- and 9-figure brands).
If everything else stayed the same, profit shrinks by almost 75 % (see the table below).
To get back to even, you would need to get almost twice as efficient with ads – more considering pick-pack-ship is part of that variable cost figure.
Unlikely to happen.
Our latest report showed the average company saw a ~10 % drop in ROAS in Q1, and when we looked at data for all of last year, the average was only a modest 2.6 % gain.
The reality is, y’aint gonna be fixed-cost-cutting or marketing your way around tariffs.
Brands need to be focused on unit economics.
3. Ways to Improve Unit Economics
When we think of unit economics, we often over-simplify to two things: COGS and price.
But the reality is you have a breadth of opportunities (and you should be analyzing all of them).
In New York, I talked with one founder who saved money switching to a new type of packaging.
I talked with another who found an entirely new supplier (in a new country, not named China).
And I know others who are implementing new refund policies, or bringing on inventory loss recovery partners to refurb and resell used product.
Generally you’re looking at some combination of:
- Product innovation
- Negotiating with suppliers
- Adjusting prices with customers
- Reexamining return policies and reverse logistics
Each of these obviously impacts conversion differently, so we have to put the options in context with your brand/audience.
Benchmarking helps. You can download the full report below.
Download the complete report here
I’d love to hear your thoughts on the report – if there was anything that you found particularly interesting, other takeaways, or any questions about how we put it together. Reach out on LinkedIn if you’d like to get in touch.
Until next time,
Sam Hill
Founder & CEO, Ecom CFO